![]() AI Tools
AI Tools
ChartPixel
Turn raw data into report with graphs and insights in seconds!
ChartPixel Embed Code
ChartPixel AI Tool
Instantly visualize your raw data through graphs and written insights that are both visually appealing and statistically accurate.
Eliminating the complexity of traditional data analysis tools, it delivers an intuitive way to grasp data patterns and craft compelling data insights presentations with AI-assisted annotations. All within 30 seconds - no matter the skill level.
ChartPixel features:
- Instantly visualize your data through dynamic graphs and insights that are both visually appealing and statistically accurate.
- Cleans up your messy data in Excel, CSV, or Google Sheets and create new, valuable features.
- Automatically selects relevant columns and chart types supported by AI-powered explained insights.
- Convert data insights into PowerPoint presentations with just one click. The presentations combine visual appeal with statistical accuracy. Upcoming features include dashboard publishing and exporting to Word and Excel.
- Questionnaire analysis: Analyze multi-select questions, perform in-depth segmentation analysis, support abbreviating long column names, and perform comment and text analysis for survey analysis backed by statistics.
- API is available to show your analysis and graphs directly on your platform.
- Get insights on the go, ChartPixel is mobile-friendly!
ChartPixel is ideal for students, researchers, entrepreneurs, business professionals and data analysts who need to analyze and visualize data quickly and efficiently without the complexities of traditional data analysis tools.
ChartPixel Categories
Other AI Tools
Alternatives to ChartPixel
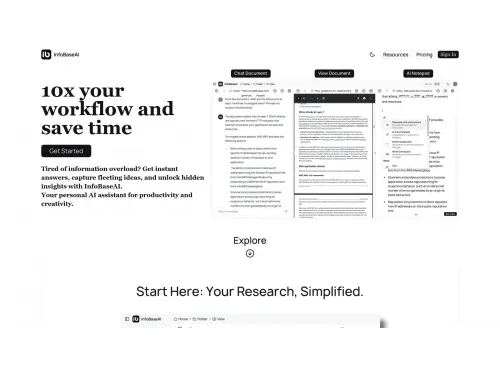
InfoBaseAI
Maximize workflow, save time efficiently

ChartPixel
Turn raw data into report with graphs and insights in seconds!

Competitor Research
Fast and easy competitor research for businesses

MetaMuse
Let's make your brand unforgettable.